 (1)
(1)Home • People • Courses • Program • Research • Clinic • Goals • Kiosk • News
Understanding Basic Statistics • Fitting • Exercise • Excel • Igor • Kaleidagraph • Origin • Power Laws • Dimensional Analysis
Mean or Average
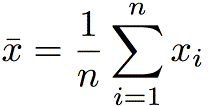
The mean or average of a set of values is the sum of the values
divided by the number of the values. Symbolically,
 (1)
(1)The mean of a number of repeated measurements of an experimental quantity is the best estimate of the true value of the quantity.

Standard deviation
The standard deviation of a set of values is a measure of the typical
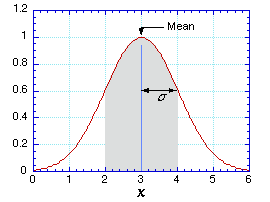
distance between the average and any given value. It measures the "width"
of the distribution of values, as shown in the figure.
Imagine plotting a histogram of the horizontal distance x traveled by a projectile launched from a (rather shoddy) spring-loaded launcher. If the projectile is launched a great many times, the distribution of x (in meters) might look like that shown in the figure. The shaded region shows the measurements that are within one standard deviation of the mean. This comprises about 68% of the measured values (68% of the total area under the red curve).
The (sample) standard deviation is defined by
 (2)
(2)When you perform repeat trials of an experiment to obtain the best possible estimate of the value of a quantity, as described above, you virtually never obtain the "exact right answer". Imagine making several launches of the projectile, whose distribution function is shown in the figure above. On each measurement, you have about a 68% chance of obtaining a measurement in the gray region, within one σ of the mean. If you make a number of measurements and average them, though, you will obtain average values that cluster ever closer to the true mean as you increase the number of measurements that you average. The distribution of averages narrows around the true mean, and has a width called the standard error or the standard deviation of the mean (SDOM, for short). It is given by
The standard error is usually the best way to characterize the uncertainty in the average you compute from making n measurements of the same quantity.
Understanding Basic Statistics • Fitting • Exercise • Excel • Igor • Kaleidagraph • Origin • Power Laws • Dimensional Analysis
 |
Copyright ©
Harvey Mudd College Physics Department 241 Platt Blvd., Claremont, CA 91711 909-621-8024 http://www.physics.hmc.edu/ WebMaster (at) physics.hmc.edu Last modified: 05 January 2010 |