Home •
People •
Courses •
Program •
Research •
Clinic •
Goals •
Kiosk •
News
Understanding Basic Statistics •
Fitting •
Exercise •
Excel •
Igor •
Kaleidagraph •
Origin •
Power Laws •
Dimensional Analysis
Power Law
When one quantity (say y) depends on another (say x) raised
to some power, we say that y is described by a power law. For
example, the distance traveled by an object in free fall (in the absence
of air resistance) is given by
s(t) = 1/2 gt2 (1)
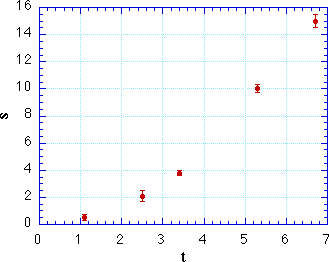
 Ignoring the dependence on g, this equation says that s is
proportional to the square of t. Plotting on linear (Cartesian)
axes produces a parabola. Now, a parabola is a very beautiful curve, but
it is difficult to eyeball a curve and say with confidence that it is
a parabola. It is even harder to eyeball some data points, with their
uncertainties, and tell whether they follow a parabolic curve.
Eyeballs are much happier with straight lines.
There is a handy way to convert this power-law relationship into a straight
line; just take the logarithm of both sides of the equation:
log(s) = 2 log(t) + log(1/2 g) (2)
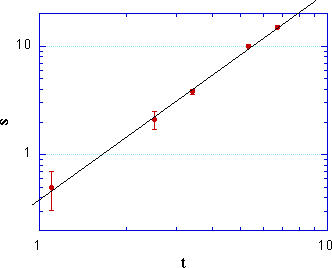
 If we plot log(s) on the y axis and log(t) on the
x axis, we get a straight line with slope 2 (which is the exponent
of t). Using Kaleidagraph or Origin you can just double-click
the axes to convert the display from linear to logarithmic. You can also
perform a proper c2 fit, as described on the Fitting page.
Understanding Basic Statistics •
Fitting •
Exercise •
Excel •
Igor •
Kaleidagraph •
Origin •
Power Laws •
Dimensional Analysis
 |
Copyright ©
Harvey Mudd College Physics Department
241 Platt Blvd., Claremont, CA 91711
909-621-8024
http://www.physics.hmc.edu/
WebMaster (at) physics.hmc.edu
Last modified: 26 August 2012
|
 Ignoring the dependence on g, this equation says that s is
proportional to the square of t. Plotting on linear (Cartesian)
axes produces a parabola. Now, a parabola is a very beautiful curve, but
it is difficult to eyeball a curve and say with confidence that it is
a parabola. It is even harder to eyeball some data points, with their
uncertainties, and tell whether they follow a parabolic curve.
Eyeballs are much happier with straight lines.
 If we plot log(s) on the y axis and log(t) on the
x axis, we get a straight line with slope 2 (which is the exponent
of t). Using