Home • How do I...? • Kaleidagraph • Fitting Exercise • Origin 3.5 • Origin 4.0 • Lab Note Books
Origin is an easy-to-use data analysis and graphics program that runs in Windows on PCs. These instructions apply to version 3.5 that is available on the HMC server.
Entering Data
You may type data directly into a data sheet or import data from a text file.
Type your data in columns noting the following points:
Use the File|Import Ascii command to access the text file. Many different file configurations can be handled by setting appropriate file import options.
Select the column holding the x data and select Column|Set as X.
If you have a column of errors, select it and issue the command Column|Set as Error Bars
To plot data with error bars, select the x, y, and errors columns and issue the command Plot|Scatter. It may be useful at this point to expand the window by clicking the up arrow at the right of the title bar.
By default, Origin adjusts the range of each axis automatically. You can override its choices by double-clicking on the axis and changing settings in the dialog.
Similarly, double click on axis labels to edit them. Buttons are provided in the edit text dialog to allow subscripts, superscripts, Greek characters, boldface, and italics.
By default, Origin does not put a frame around the plot area. You should. Here's how:
Data points should be plotted as individual points with a symbol size that makes sense for the number of data points in the plot and the plot size. There should not be a line connecting successive points. Points should be shown with error bars, if available. Make a column of error bars on your data sheet.
Annotating the Graph
You may add additional text labels using the text tool ("T" in the tool
palette) and lines, with or without arrows, with the line tool. Labels you
don't want can be deleted by selecting them and pressing Del.
For a quick and dirty fit, select Fit|Line when a plot is front-most. Note: this fit does not pay attention to error bars. It is therefore useful only when each point has the same error in y and you don't care to inquire how confident you should be in the fit. In most cases, you will want to know the value of c2 for your fit. To get this, you must define a fit function, as described in the following section.
As an example, consider a linear fit function of the form y = mx+ b. This function has two free parameters, namely m and b. First define the function with Fit|Select Fitting Function, click on Define New Function, and enter a name in the Function Name box.
Under Parameters, click the User-defined Names button, then click in the Parameter Names box and type m,b.
Click in the large equation box at the bottom and type the equation m*x+b, then click OK.
Fit|StarFitting Session starts the fit. Set initial values for each parameter, then click Update Fit Curve to see the curve plotted on the graph. For a linear fit, it doesn't matter how close the curve is to the data, but for a general nonlinear fit, it is crucial that the initial values of the parameters be close to the best-fit values. Adjust the parameters until the curve "has the spirit of the data", then click Fit. When the fit is done, click Plot, then OK to paste the results onto the graph. Note the value of Chi^2 is really c2 per degree of freedom.
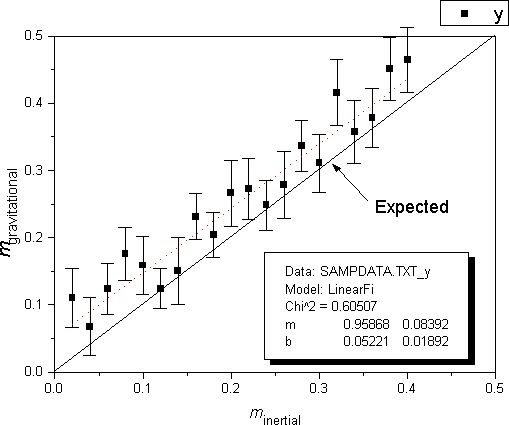
From the fitting window click to add the fit information to the plot. A shadow box with the best values of the fit parameters, their estimated uncertainties, and Chi^2 is displayed. The value is really the reduced c2, that is, c2 divided by the number of degrees of freedom.
For including a graph in a technical report or publication, you should copy down the information from the fit, remove it from the graph, and place it in the figure caption.
For use in a lab notebook, it is very convenient to print a version of your graph that is small enough to permit you to annotate the graph and explain its significance on the same notebook page. A graph with a plot area of about 4 inches by 3 inches is quite good for this.
Left to its own devices, Origin will fill the entire page. This is usually bigger than you want. To shrink it down, click on the lower right corner of the plot area until you get a square drag handle. Resize the plot area until it is the size you want. Better yet, double click on the gray box with the number "1" in it at the top-left corner of the plot. Set the units to "inch" and type in 4 inches wide by 3 inches high for the plot area.
|
|
Copyright © 2001 Harvey Mudd College Physics Department http://www.physics.hmc.edu/ WebMaster@Physics.hmc.edu This page was last modified on Wed, Jan 21, 1998. |